DSP
System-wide audio processing · Linux · PipeWire
Parametric EQ and upsampling for everything you play, with filters you can inspect.
Beta · 0.9.3Packages for Arch, Debian / Ubuntu and Fedora. Free and open source.
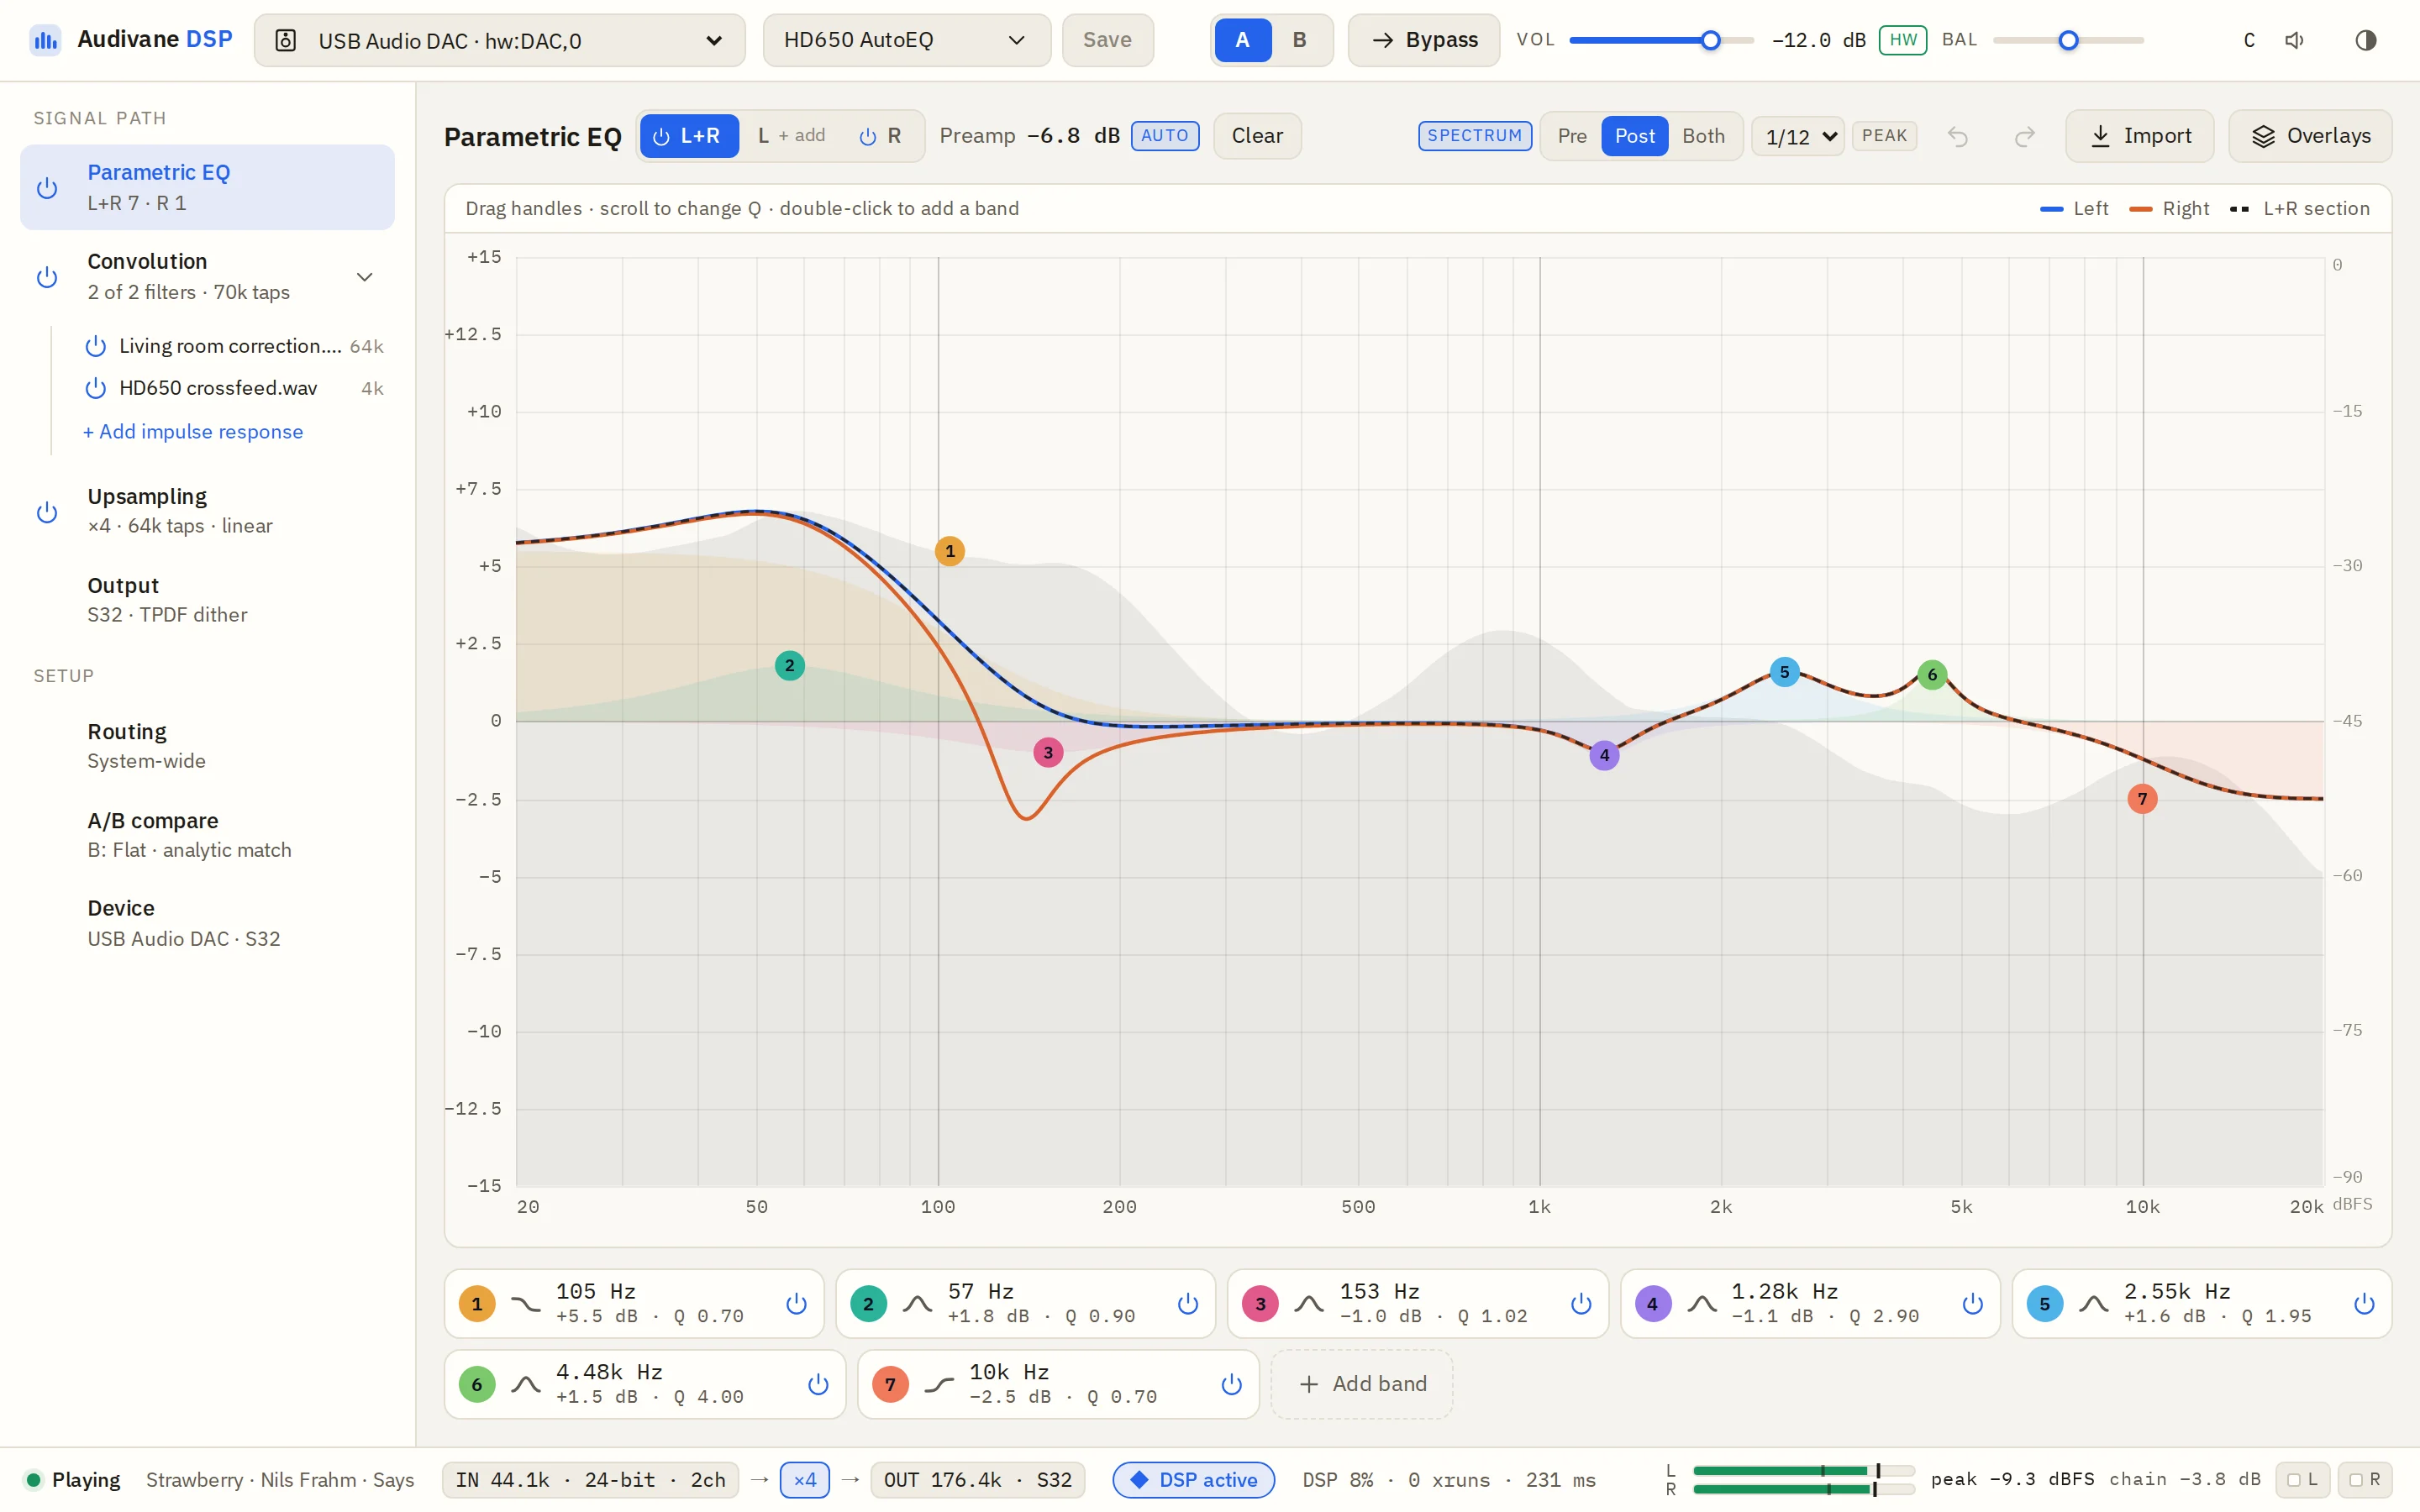
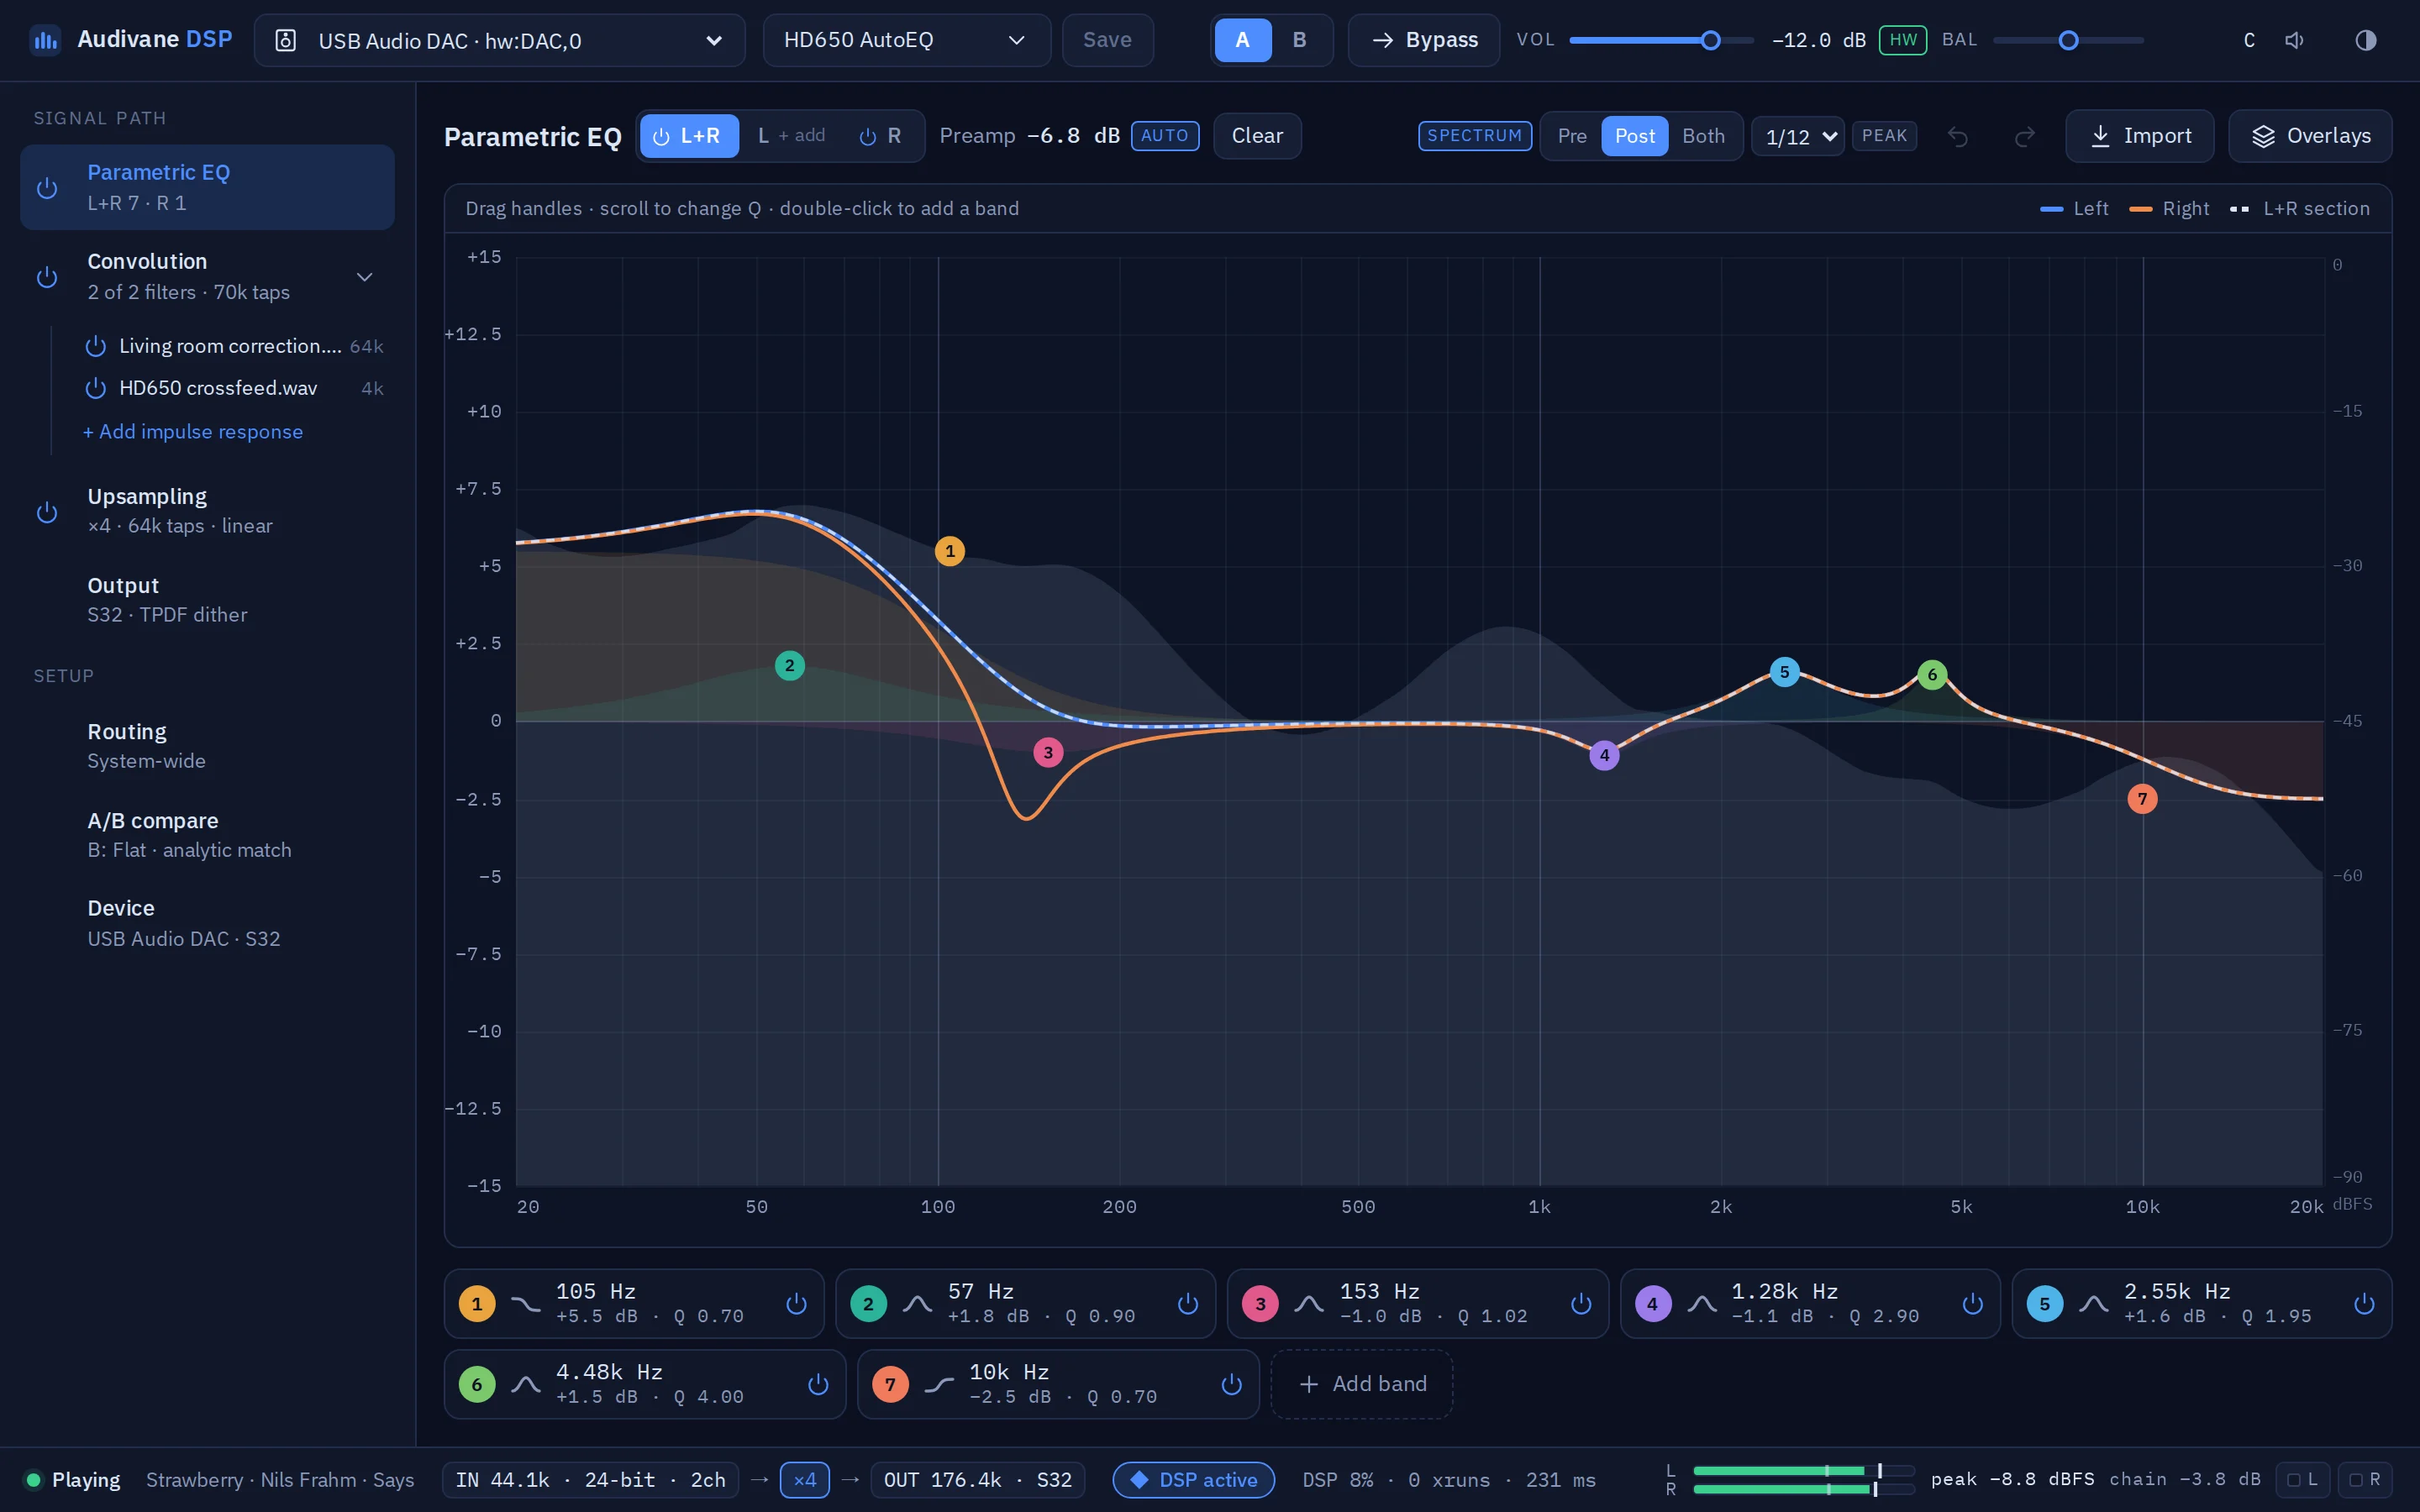
The app running on its built-in mock engine. The spectrum and meters are simulated in this capture.
One processor for the whole system.
Audivane DSP opens your DAC directly over ALSA, drives the PipeWire graph from the DAC's own clock and processes audio in 64-bit floating point. A desktop app shows and edits every stage while it runs.
Two outputs
A system-wide DSP sink for everyday use, and a bit-perfect sink for a dedicated music player.
Parametric EQ per channel
Layered sections for L+R, L and R; AutoEQ import and target overlays.
Convolution
Load impulse responses, for example room correction or crossfeed.
Upsampling
Up to 4M taps and Kaiser β 20, linear or minimum phase. “Stop at Nyquist” reaches the full stopband at the source Nyquist. Every filter is plotted from its measured response.
Live meters and spectrum
Peak meters with clip indication, and a live spectrum drawn behind the EQ curve.
A/B comparison
Switch between two chains with A-weighted level matching; TPDF or noise-shaped dither on output.
Left, right, or both.
Bands live in an L+R section that applies to both channels, and optional L and R sections layered on top. The graph draws each channel's resulting curve, so a right-only correction is visible as its own line. Drag a handle to move a band, or type exact frequency, gain and Q values.
In the screenshot above, an R-only band at 138 Hz pulls the right channel's curve (orange) away from the left (blue); the dashed line is the shared L+R section.
See what is playing.
The status bar follows the stream from source format through the upsampling ratio to the DAC's output format, with DSP load, xruns and latency. Peak meters show RMS, peak hold and headroom, with a clip indicator per channel. A live spectrum of what is playing, before or after the EQ, is drawn behind the EQ curve.


Filters you can inspect.
The upsampler converts to a higher output rate with a windowed-sinc filter, linear or minimum phase. The app measures the filter it actually built and plots the transition around the source Nyquist frequency, the full-range response and the impulse response, with the frequencies where the response crosses each level.
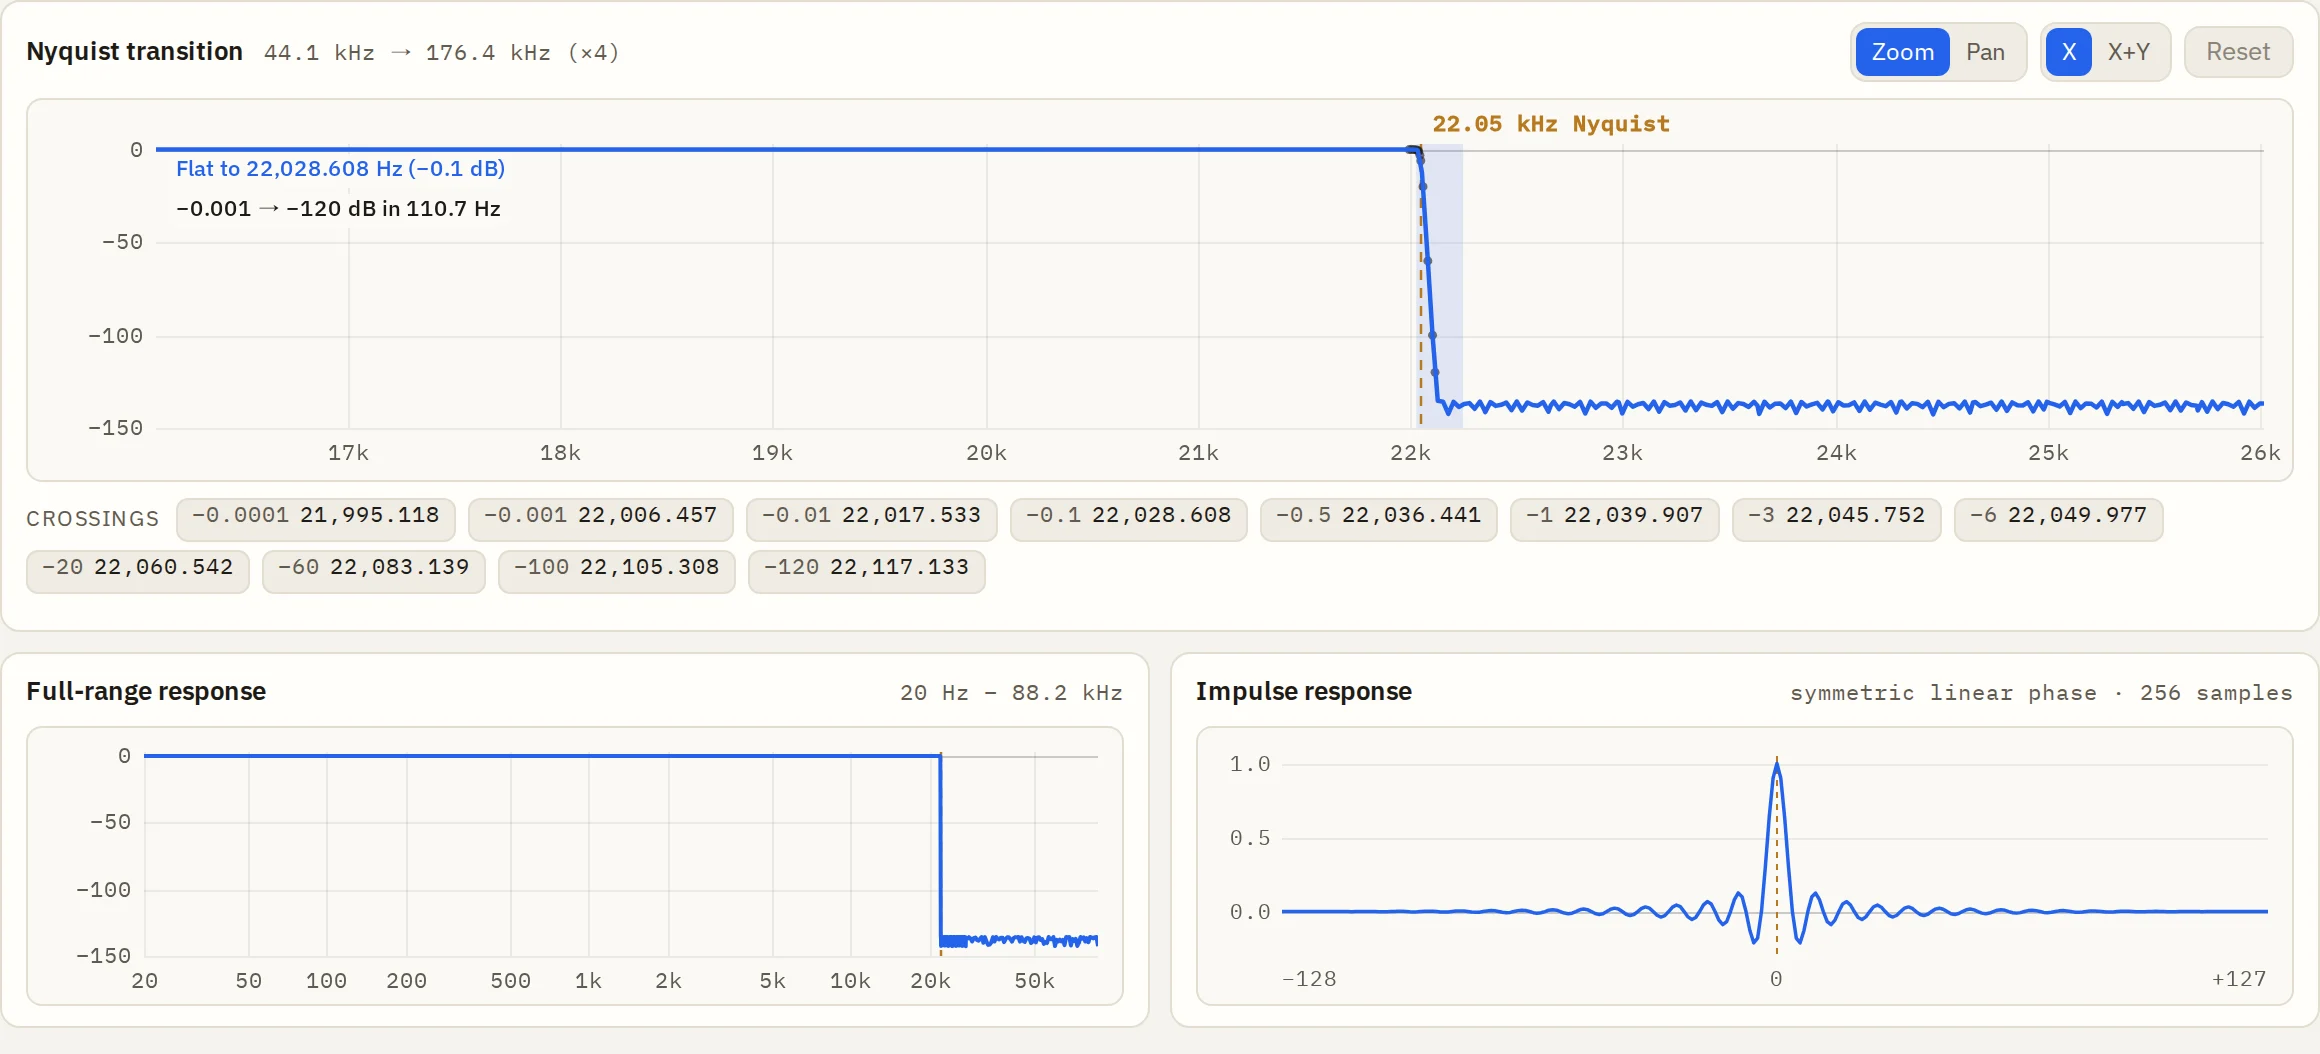
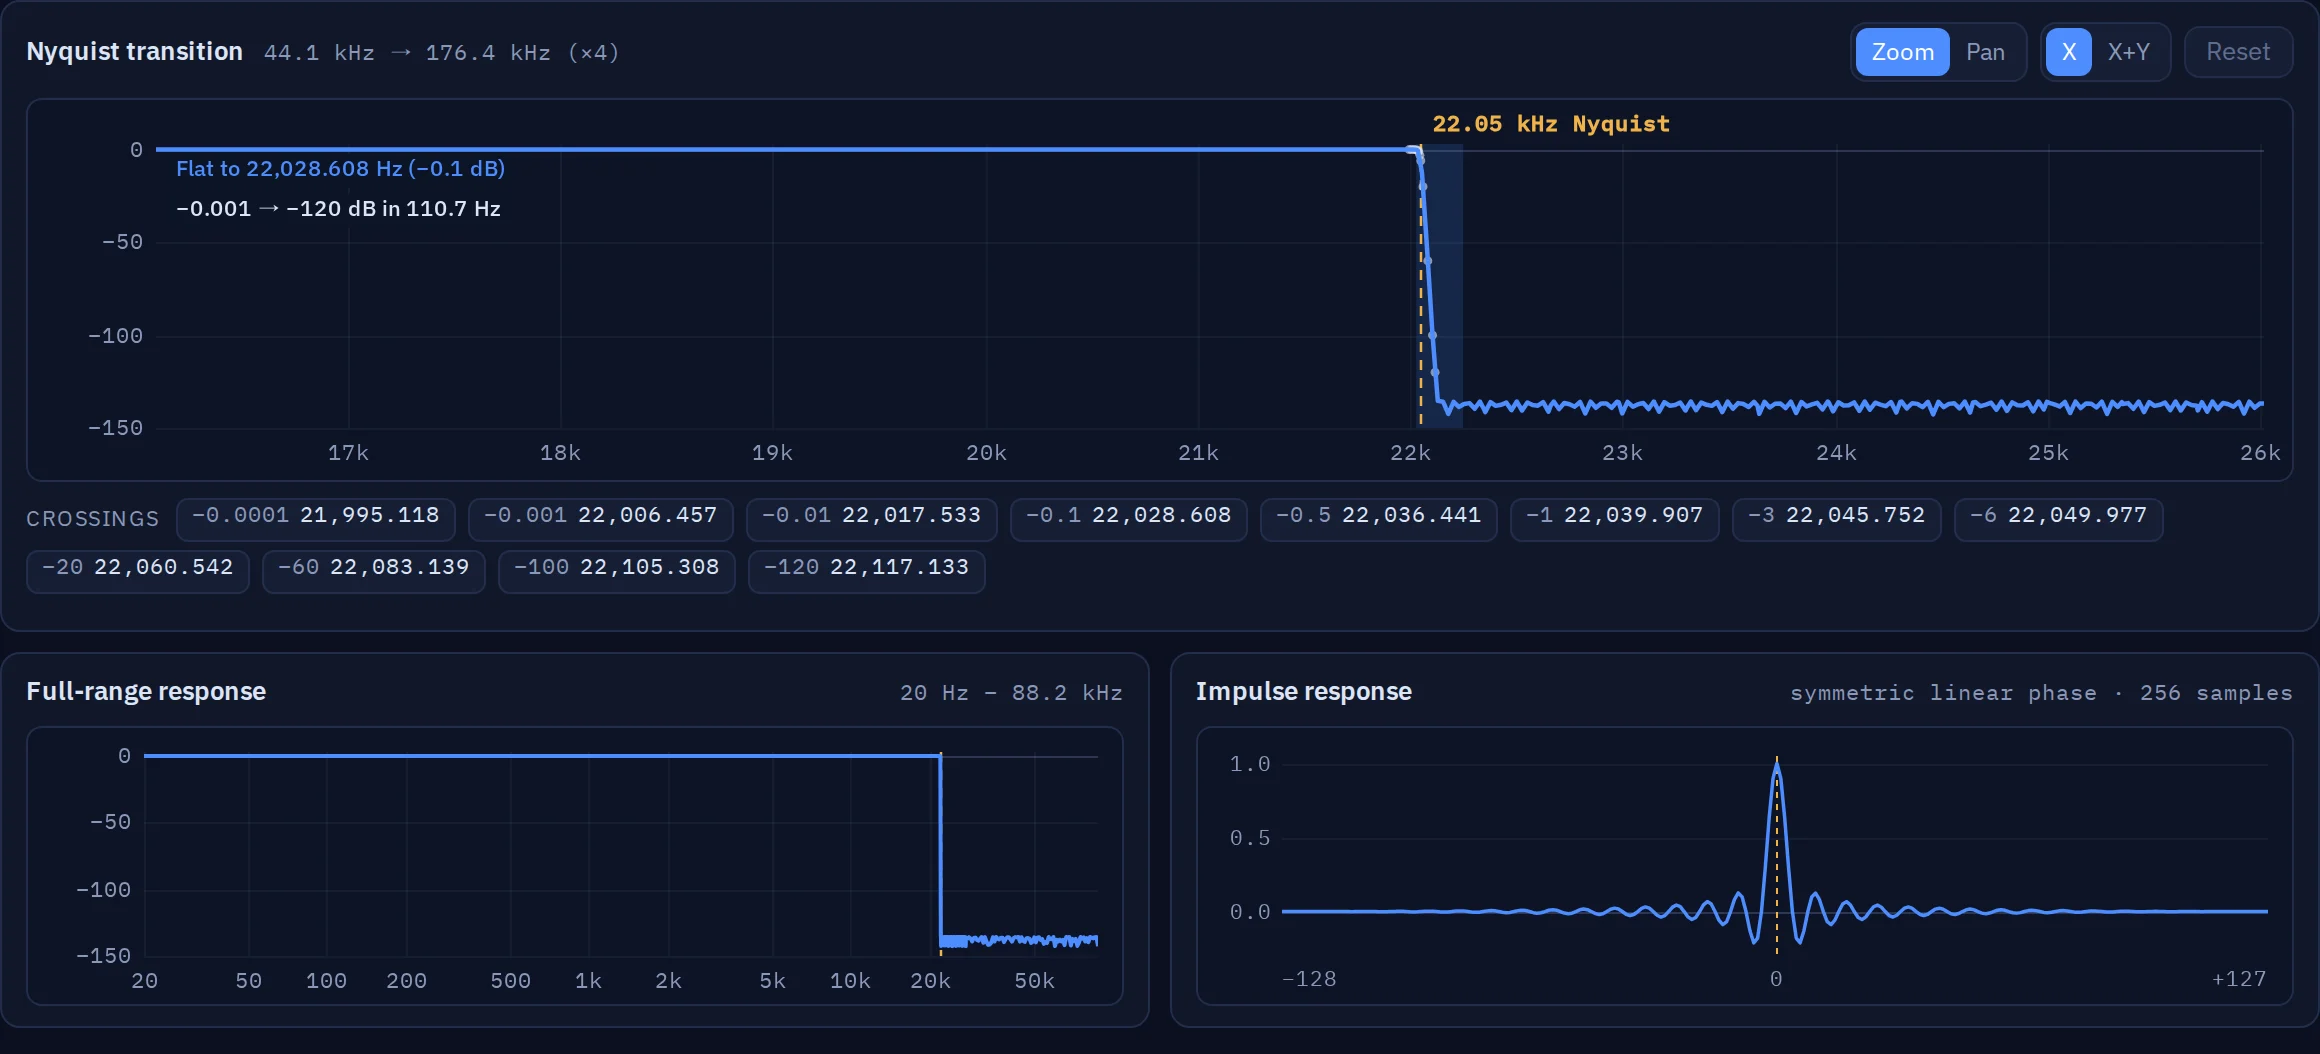
Captured on the app's mock engine: the response, impulse and crossing values shown are simulated, not measurements of a real filter.
The filter's window has four presets. A Kaiser window's β trades transition width against stopband depth: a lower β gives a steeper transition, a higher β pushes the stopband further down. The app shows the measured result; it does not claim that one preset sounds different from another.
| Preset | Kaiser β | Stopband (design) | Trade-off |
|---|---|---|---|
| Steeper | 10 | ≈ 99 dB | Narrowest transition from passband to stopband for a given filter length, with a shallower stopband. |
| Standard | 14 | ≈ 136 dB | The default balance of transition width and stopband depth. |
| Deeper | 17 | ≈ 163 dB | A deeper stopband, paid for with a wider transition. |
| Deepest | 20 | ≈ 190 dB | The deepest stopband and the widest transition. |
Version 0.9.3, beta.
Audivane DSP runs on 64-bit Linux with PipeWire and WirePlumber. Packages for Arch, Ubuntu 24.04+ / Debian and Fedora are on GitHub Releases with SHA-256 checksums. After installing, start the engine for your user and open “Audivane DSP” from your app menu.
curl -fLO https://github.com/audivane/dsp/releases/download/0.9.3/audivane-dsp-0.9.3-1-x86_64.pkg.tar.zst && sudo pacman -U ./audivane-dsp-0.9.3-1-x86_64.pkg.tar.zstcurl -fLO https://github.com/audivane/dsp/releases/download/0.9.3/audivane-dsp_0.9.3-1_amd64.deb && sudo apt install ./audivane-dsp_0.9.3-1_amd64.debsudo dnf install https://github.com/audivane/dsp/releases/download/0.9.3/audivane-dsp-0.9.3-1.x86_64.rpmgit clone https://github.com/audivane/dsp.git && cd dspSetup, routing and troubleshooting: DSP docs. Source code: github.com/audivane/dsp (AGPL-3.0-only).